Getting Started
Rationale & Theory
This software package is a spin-out product from the computational chemistry core of the ASAP Discovery Consortium. Antiviral drug discovery (or any other therapeutic area where mutagenesis of targets is critical to success of drugs) depends heavily on exhaustive exploration of mutational space of therapeutic targets and there is a need to translate these large bodies of data into forms that can be used to instruct decision-making downstream in the drug discovery process.
choppa was built because in the ASAP Discovery Consortium there was a need to marry Deep Mutational Scanning (DMS) data (or phylogenetic analyses) with structural biology data. Although simply plotting whatever average (or min/max) fitness value each residue in the DMS data has produces an attractive figure, these types of visualizations are not helpful to medicinal chemists downstream during decision-making moments as they obfuscate a lot of critical information. Instead, there is a need to know how many mutations can realistically occur at a given residue, given the population of fitness values associated with its measured mutants.
To count the number of mutations that will realistically occur for a given residue we will need to define a fitness threshold. This is a value highly dependent on the DMS (or phylogenetics) experiment that acts as the threshold above which a mutation is considered fit. This value may be decided by experimentalists or by analyzing whether there is a clear gap between fitness values between wildtype sequences and mutants in catalytic residues, for example:
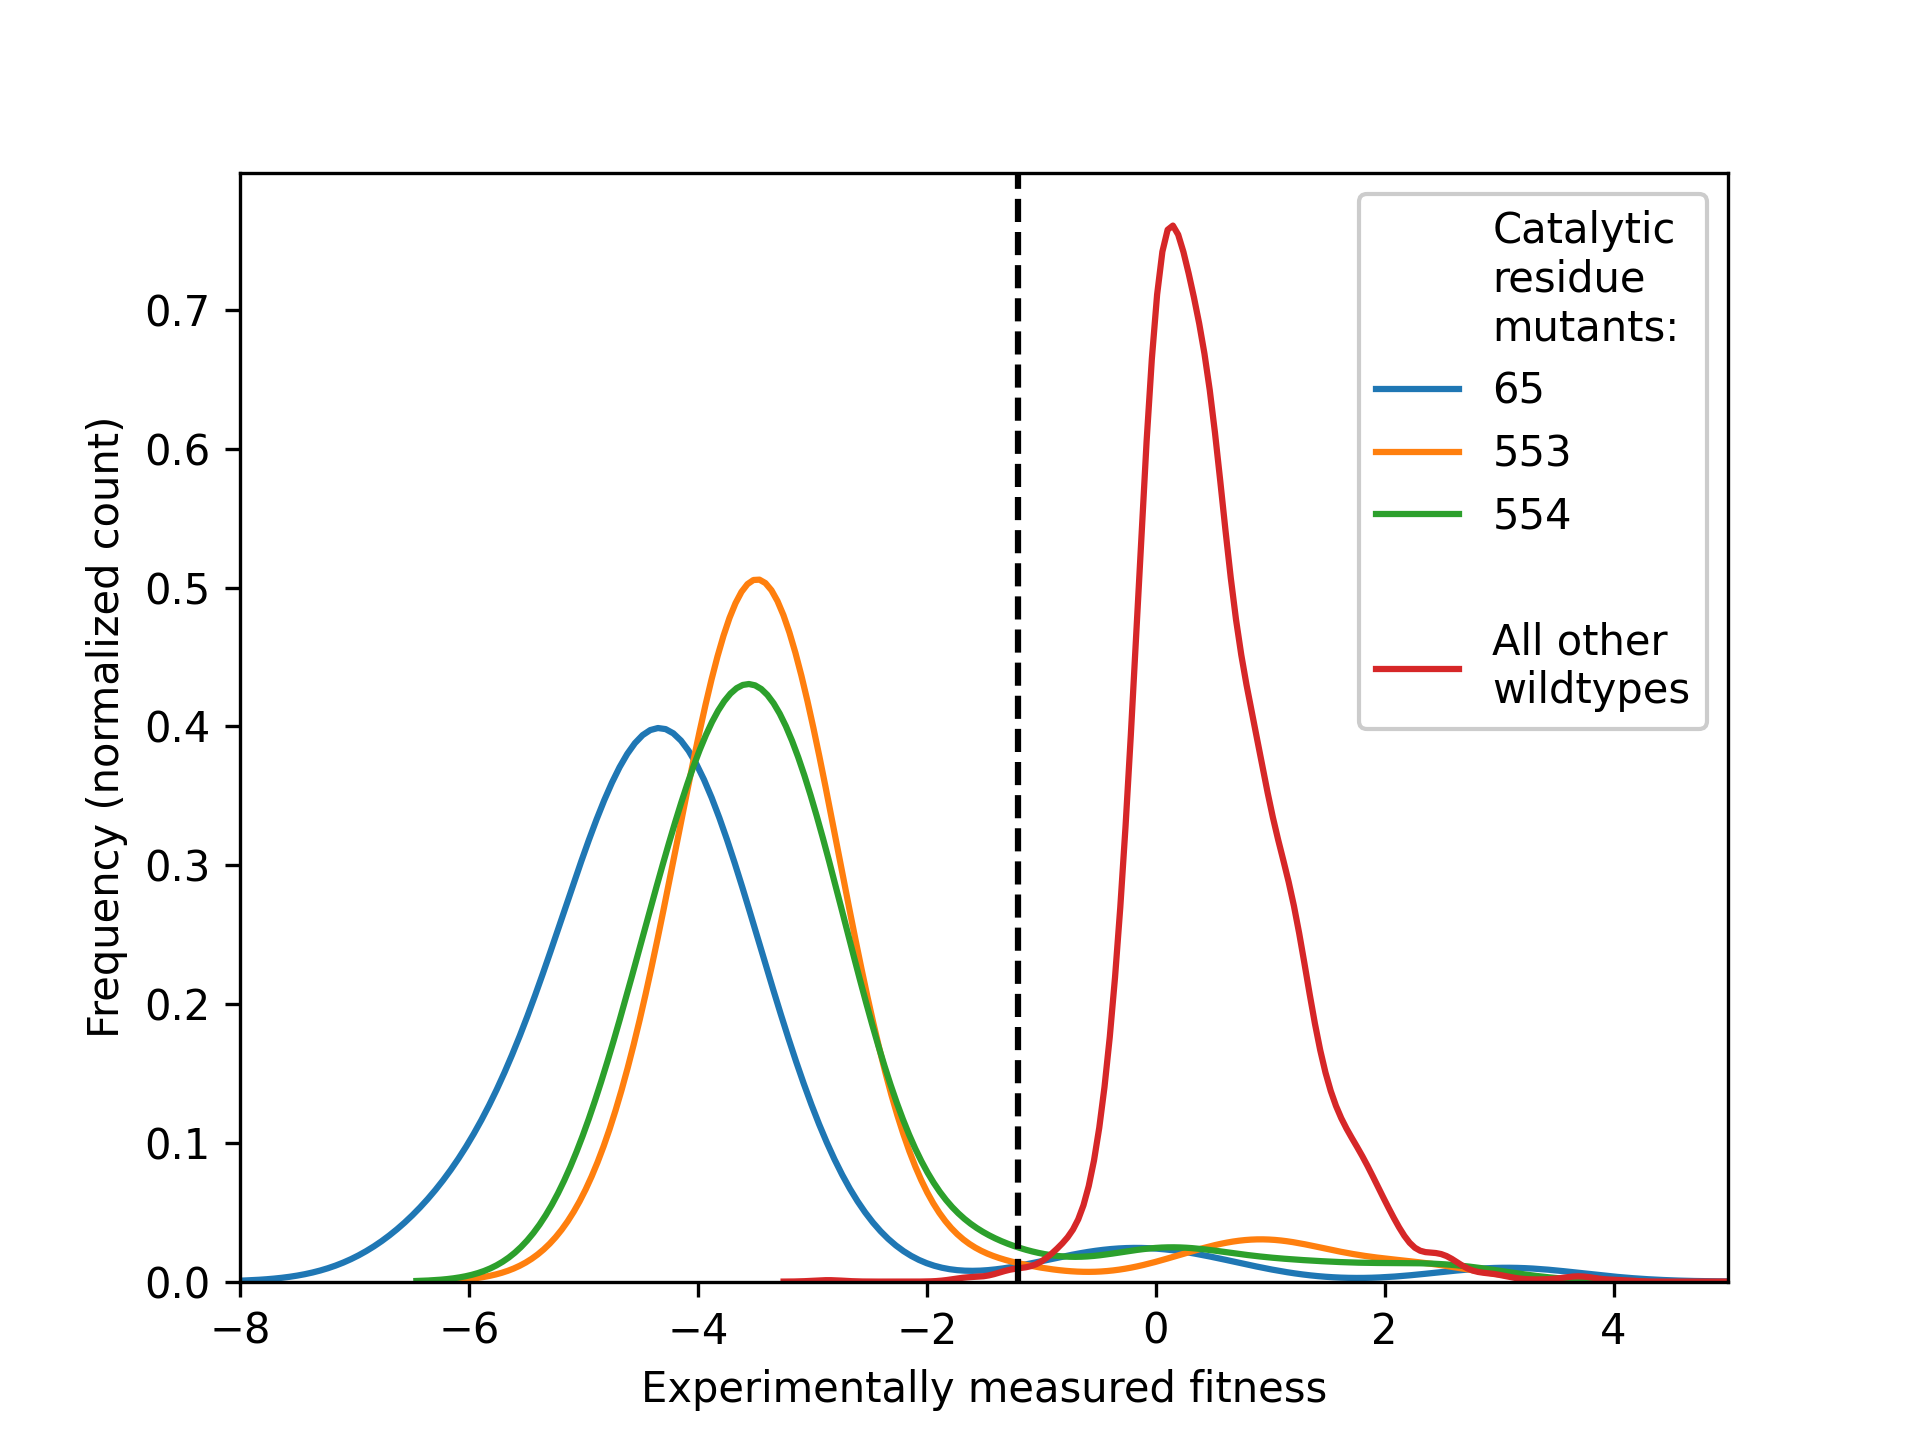
Here, we show the density distributions of the population of fitness values for all mutants of three catalytic residues of a target (blue, green and orange on left-hand side). All samples of the experiment where the sequence was fully wildtype (red, right-hand side) shows much higher fitness values, with a clear divide in between the two sets of distributions. The center of this fitness value is an ideal candidate for a fitness threshold.
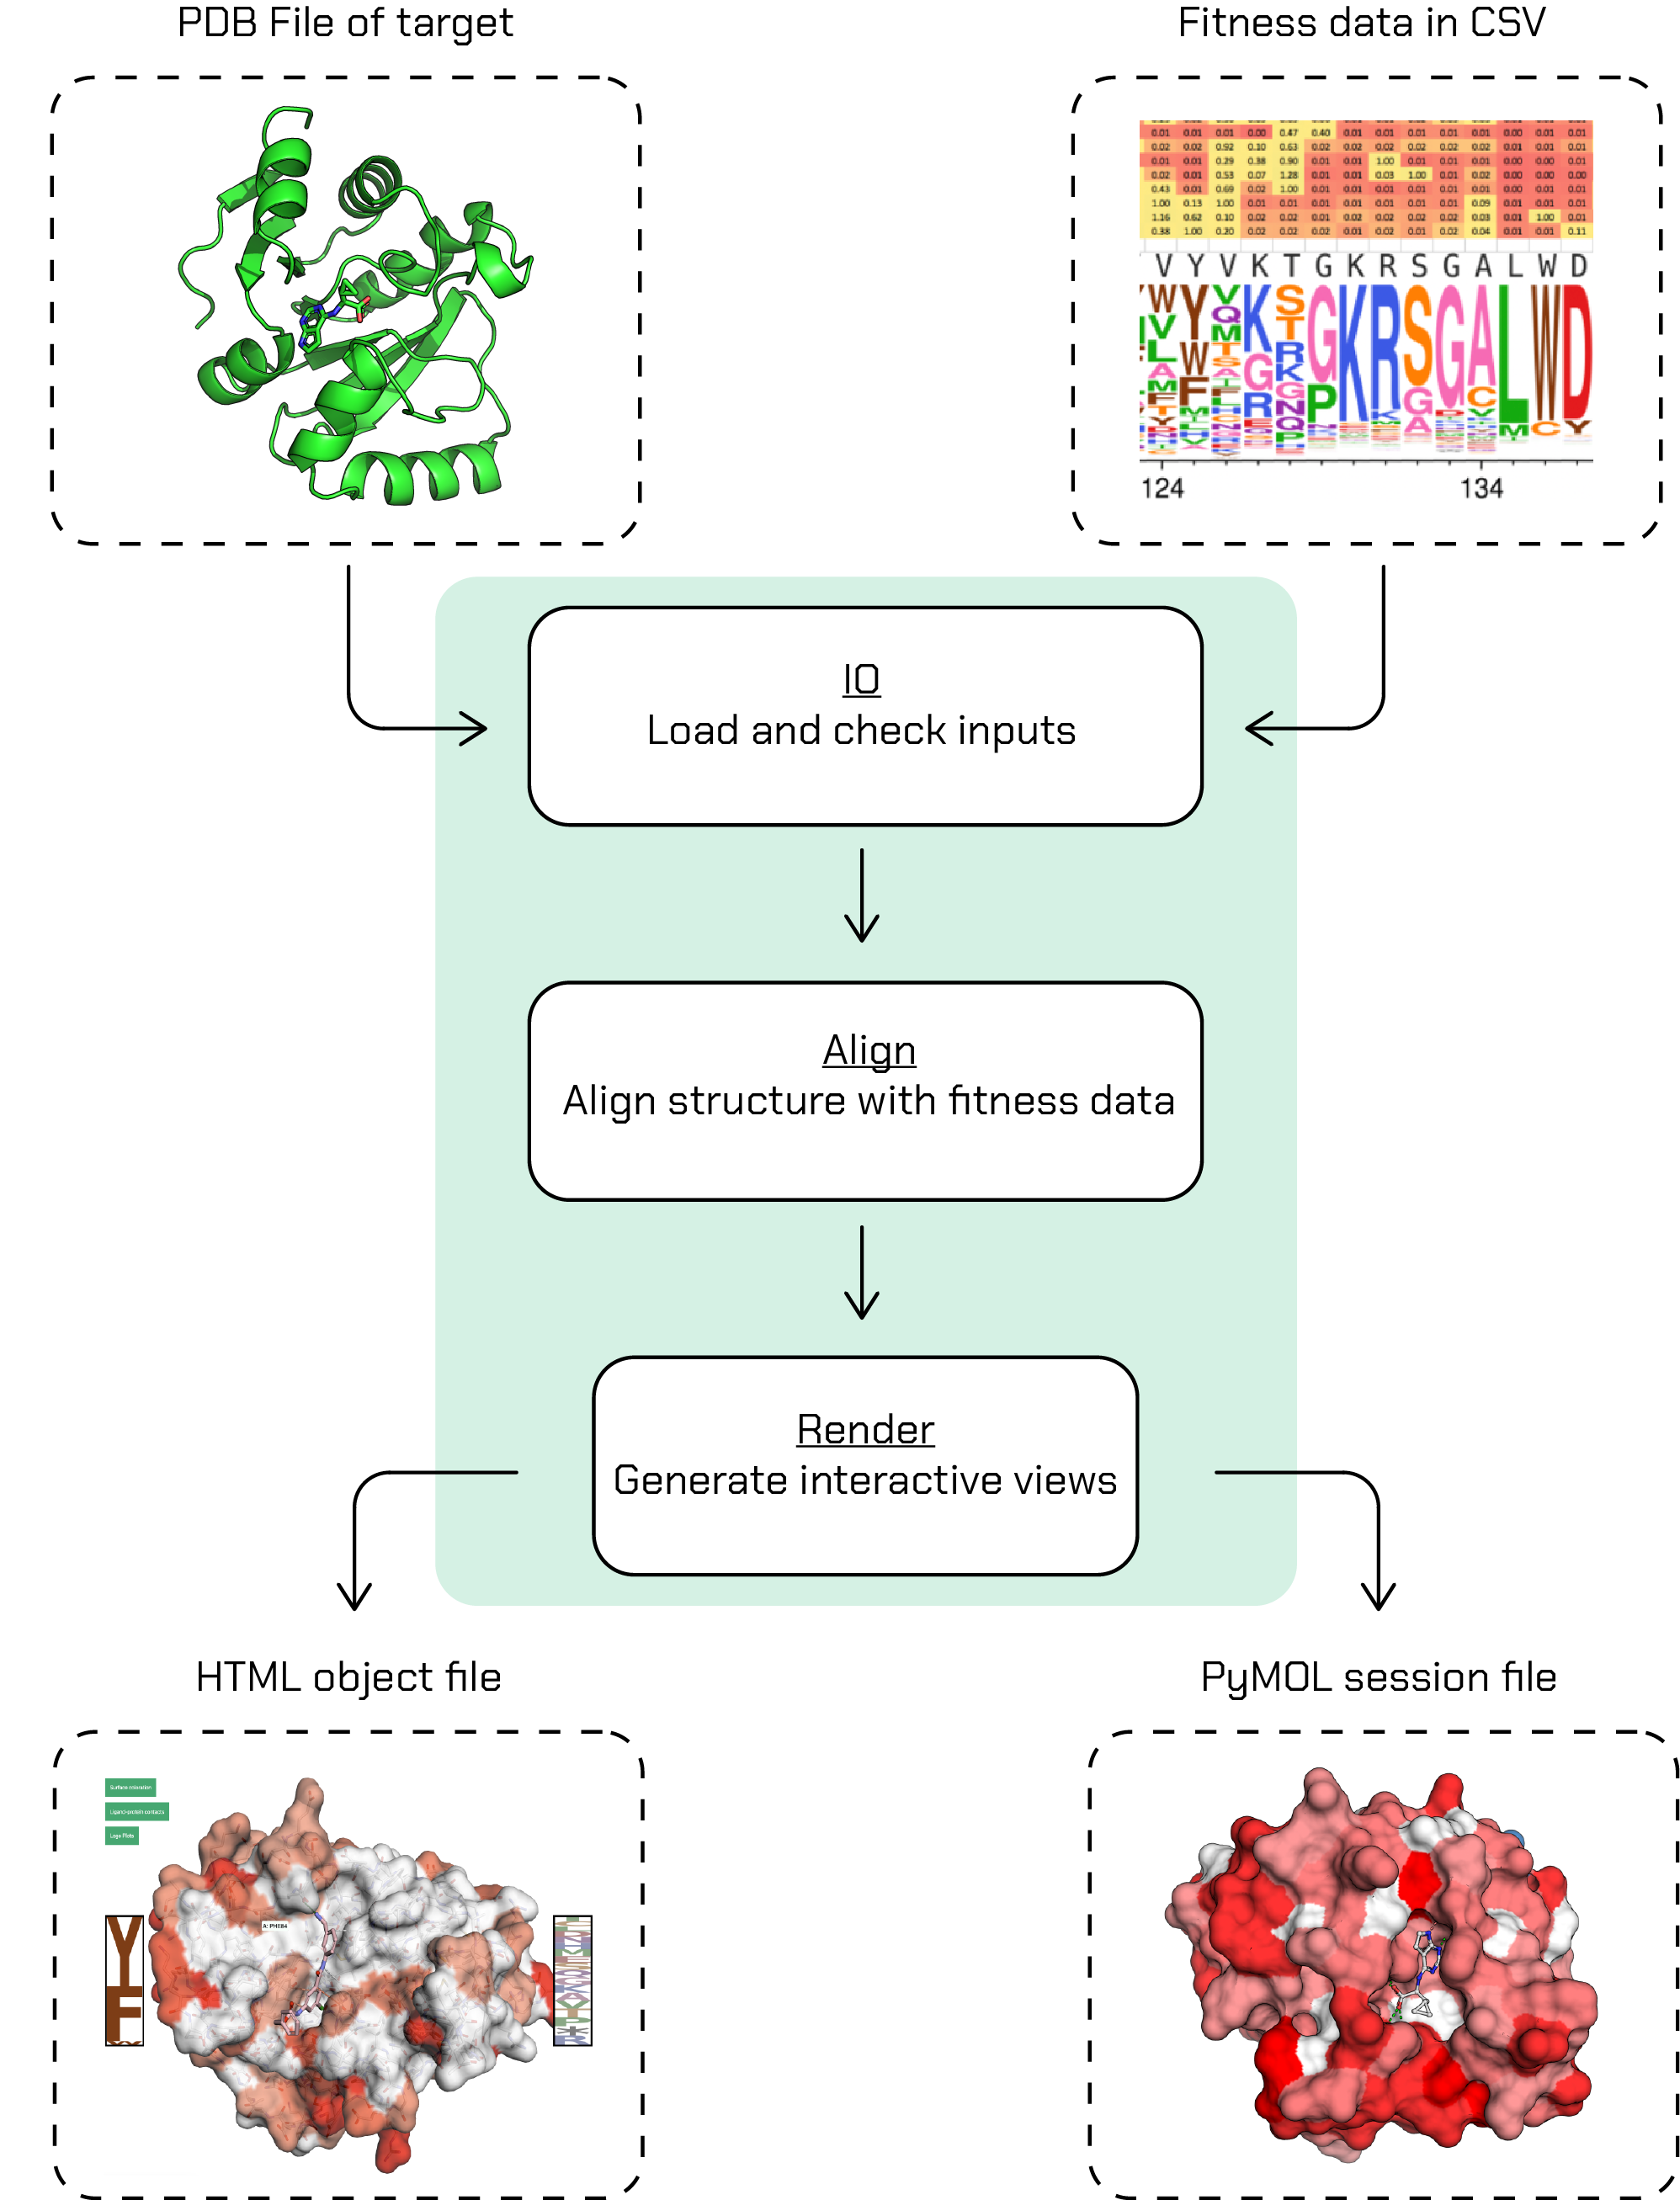
choppa will require the fitness data (with fitness threshold) and crystal structure to map it on as inputs to its CLI. With a single CLI render command, choppa will go through its workflow and generate the outputs:
Note
This project is under active development.
Installation
Clone the choppa github repository:
git clone https://github.com/asapdiscovery/choppa.git
Install the dependencies into a conda environment with:
conda env create --file=devtools/conda-envs/choppa.yaml
(for installing conda, see e.g. micromamba)
Activate your new environment:
conda activate choppa
Install the choppa package with pip in the top folder of the code:
pip install -e .
Check that you can run choppa by running:
choppa --help
Tutorial
Although choppa has a complete python API for you to work with, the easiest way to generate fitness views with choppa is using its command-line interface (CLI). In your terminal, let’s pull up the main help information:
choppa --help
which should return the following:
Usage: choppa [OPTIONS] COMMAND [ARGS]...

Integrated mutational and structural biology data into a concerted HTML view.

Options:
--version  Show the version and exit.
--help     Show this message and exit.

Commands:
render  Create fitness view as a publication-ready PyMOL session file and a read-for-sharing interactive HTML file.
Now let’s run the main command in choppa to get its help information:
choppa render --help
which should return the following:
Usage: choppa render [OPTIONS]

Create fitness view as a publication-ready PyMOL session file and a read-for-sharing interactive HTML file.

Options:
   -p, --pdb-file FILE             Path to a PDB file to create fitness view for.  [required]
   -f, --fitness-file FILE         Path to a CSV file with fitness data to create fitness view for.  [required]
   -ft, --fitness-threshold FLOAT  Fitness threshold to determine whether a mutant is fit or not.  [required]
   -op, --outfile-publication FILE
                               Name of output file to write publication-ready PyMOL session file to. Should end in '.pse'; defaults to 'out.pse'.
   -oi, --outfile-interactive FILE
                               Name of output file to write ready-to-share interactive HTML file to. Should end in '.html'; defaults to 'out.html'.
   -fc, --fitness-column TEXT      Name of the column in the fitness-file (-f/--fitness-file) that contains fitness values (e.g. LogEffect). If not defined, will
                               default to 'fitness'.
   -ri, --residue-index-column TEXT
                               Name of the column in the fitness-file (-f/--fitness-file) that contains residue indices (e.g. 1, 2, .. n). If not defined, will
                               default to 'residue_index'.
   -wt, --wildtype-column TEXT     Name of the column in the fitness-file (-f/--fitness-file) that contains wildtype residues (e.g. L, G, N). If not defined, will
                               default to 'wildtype'.
   -mu, --mutant-column TEXT       Name of the column in the fitness-file (-f/--fitness-file) that contains mutant residues (e.g. L, G, N). If not defined, will
                               default to 'mutant'.
   -c, --confidence-column TEXT    Name of the column in the fitness-file (-f/--fitness-file) that contains confidence values (e.g. counts). If not defined then
                               LogoPlots in the HTML view will not display confidences.
   --help                          Show this message and exit.
There are a lot of arguments, but only the first three (--pdb-file, --fitness-file and fitness-threshold) are required. The remaining arguments can be used for telling choppa which column names it should use in your fitness CSV file. If your column names are the same as the argument defaults (see --help message) you do not need to use these arguments as choppa will automatically use the correct columns.
Let’s use some of the example files in the choppa repository to try out the CLI workflow. These can be found in choppa/data/toy_data. We’ll use the SARS-CoV-2 Mac1 protein PDB
and some fictitious fitness data.
We’ll set the fitness threshold to 0.5. To determine the fitness threshold for your fitness data, see the Determining a fitness threshold page of this documentation.
The CLI will cycle through all steps in the choppa API to generate your views:
$ choppa render -p ~/projects/choppa/choppa/data/toy_data/toy_complex_SARS-CoV-2-Mac1.pdb -f ~/projects/choppa/choppa/data/toy_data/toy_fitness_data_01_complete.csv -ft 0.5
Which will print to your terminal something like this:
INFO:root:Reading in fitness data from [..]/toy_fitness_data_01_complete.csv
INFO:root:Successfully read fitness data:
      residue_index wildtype mutant  fitness  confidence
0                 1        S      S     1.00         NaN
1                 1        S      V    -0.32         NaN
2                 1        S      I    -1.79         NaN
3                 1        S      L    -2.10         NaN
4                 1        S      E    -1.41         NaN
...             ...      ...    ...      ...         ...
3439            164        F      A    -4.36         NaN
3440            164        F      G    -4.82         NaN
3441            164        F      P    -1.13         NaN
3442            164        F      C    -1.16         NaN
3443            164        F      X     0.43         NaN

[3444 rows x 5 columns]
INFO:root:Created fitness dictionary as `FitnessFactory` of length 164
/Users/jenkescheen/micromamba/envs/choppa/lib/python3.12/site-packages/Bio/PDB/PDBParser.py:388: PDBConstructionWarning: Ignoring unrecognized record 'TER' at line 2532
  warnings.warn(
INFO:root:Aligning fitness sequence to complex..

INFO:root:Found alignment:
CSV               0 SFSGYLKLTDNVYIKNADIVEEAKKVKPTVVVNAANVYLKHGGGVAGALNKATNNAMQVE
                  0 ||||||||||||||||||||||||||||||||||||||||||||||||||||||||||||
PDB               0 SFSGYLKLTDNVYIKNADIVEEAKKVKPTVVVNAANVYLKHGGGVAGALNKATNNAMQVE

CSV              60 SDDYIATNGPLKVGGSCVLSGHNLAKHCLHVVGPNVNKGEDIQLLKSAYENFNQHEVLLA
                 60 ||||||||||||||||||||||||||||||||||||||||||||||||||||||||||||
PDB              60 SDDYIATNGPLKVGGSCVLSGHNLAKHCLHVVGPNVNKGEDIQLLKSAYENFNQHEVLLA

CSV             120 PLLSAGIFGADPIHSLRVCVDTVRTNVYLAVFDKNLYDKLVSSF- 164
                120 ||||||||||||||||||||||||||||||||||||||||||||- 165
PDB             120 PLLSAGIFGADPIHSLRVCVDTVRTNVYLAVFDKNLYDKLVSSFX 165

INFO:root:After aligning fitness data to PDB complex, filled 0 empty entries in the fitness sequence (total entries in sequence: 165).

INFO:root:Starting PyMOL session
INFO:root:PyMOL session: setting up system
INFO:root:PyMOL session: coloring system surface with fitness data..
INFO:root:PyMOL session: fitness degree per residue found using threshold 0.5:
{'n_fit_0': '', 'n_fit_1': '', 'n_fit_2': '17+86+149+165', 'n_fit_3': '5+30+36+53+82+100+109+124+127+150', 'n_fit_4': '28+31+44+49+50+98+122+128+129+131+137+140+152+164', 'n_fit_5': '6+7+8+9+10+11+12+13+14+15+16+18+19+20+21+22+23+24+25+26+27+29+32+33+34+35+37+38+39+40+41+42+43+45+46+47+48+51+52+54+55+56+57+58+59+60+61+62+63+64+65+66+67+68+69+70+71+72+73+74+75+76+77+78+79+80+81+83+84+85+87+88+89+90+91+92+93+94+95+96+97+99+101+102+103+104+105+106+107+108+110+111+112+113+114+115+116+117+118+119+120+121+123+125+126+130+132+133+134+135+136+138+139+141+142+143+144+145+146+147+148+151+153+154+155+156+157+158+159+160+161+162+163+166+167+168', 'no_fitness_data': ''}

INFO:root:PyMOL session: prettifying view
INFO:root:PyMOL session: adding ligand-protein interactions (contacts) colored by fitness degree
INFO:root:PyMOL session: writing session file to out.pse

INFO:root:Generating logoplots for 164 residues.
INFO:root:Using MultiProcessing
100%|██████████████████████████████████████████████████████████████████████████████████████████████████████████████████████████████████████████████| 164/164 [00:00<00:00, 787933.40it/s]
This should run in a few seconds depending on your hardware. You see a good amount of logging, but the main steps taken are:
processing and checking the input
PDBandCSVfilesaligning the protein sequence to the sequence found in the fitness data
creating a
PyMOLsession and writing it to a filecreating a
HTMLview and writing it to a file
Of course, the above example is an ideal situation, often the fitness data does not exactly match your PDB sequence. Your crystal structure may have some mutations, crystallography constructs or additional/missing chains. To demonstrate choppa’s alignment capabilities, you could test it with another fitness CSV which has a bunch of missing residues compared to the PDB of Mac1. This file is found in choppa/data/toy_data/toy_fitness_data_03_sectioned.csv and the alignment report looks like this:
INFO:root:Found alignment:
CSV               0 ----YLKLTDNVYIKNADIVEEAKKVKPTVVVNA--------------------------
                  0 ----||||||||||||||||||||||||||||||--------------------------
PDB               0 SFSGYLKLTDNVYIKNADIVEEAKKVKPTVVVNAANVYLKHGGGVAGALNKATNNAMQVE

CSV              30 ---------------------HNLAKHCLHVVGPNVNKGEDIQLLKSAY-----------
                 60 ---------------------||||||||||||||||||||||||||||-----------
PDB              60 SDDYIATNGPLKVGGSCVLSGHNLAKHCLHVVGPNVNKGEDIQLLKSAYENFNQHEVLLA

CSV              58 ---------ADPIHSLRVCVDTVRTNVYLAVFDKNLYDKLV----  90
                120 ---------||||||||||||||||||||||||||||||||---- 165
PDB             120 PLLSAGIFGADPIHSLRVCVDTVRTNVYLAVFDKNLYDKLVSSFX 165
As you can see the fitness data that choppa managed to align to the PDB structure is optimal.
Let’s inspect the output files. First we can open the .pse file with PyMOL and ray-trace it by running
ray
in the PyMOL terminal. The generated image will look something like this:
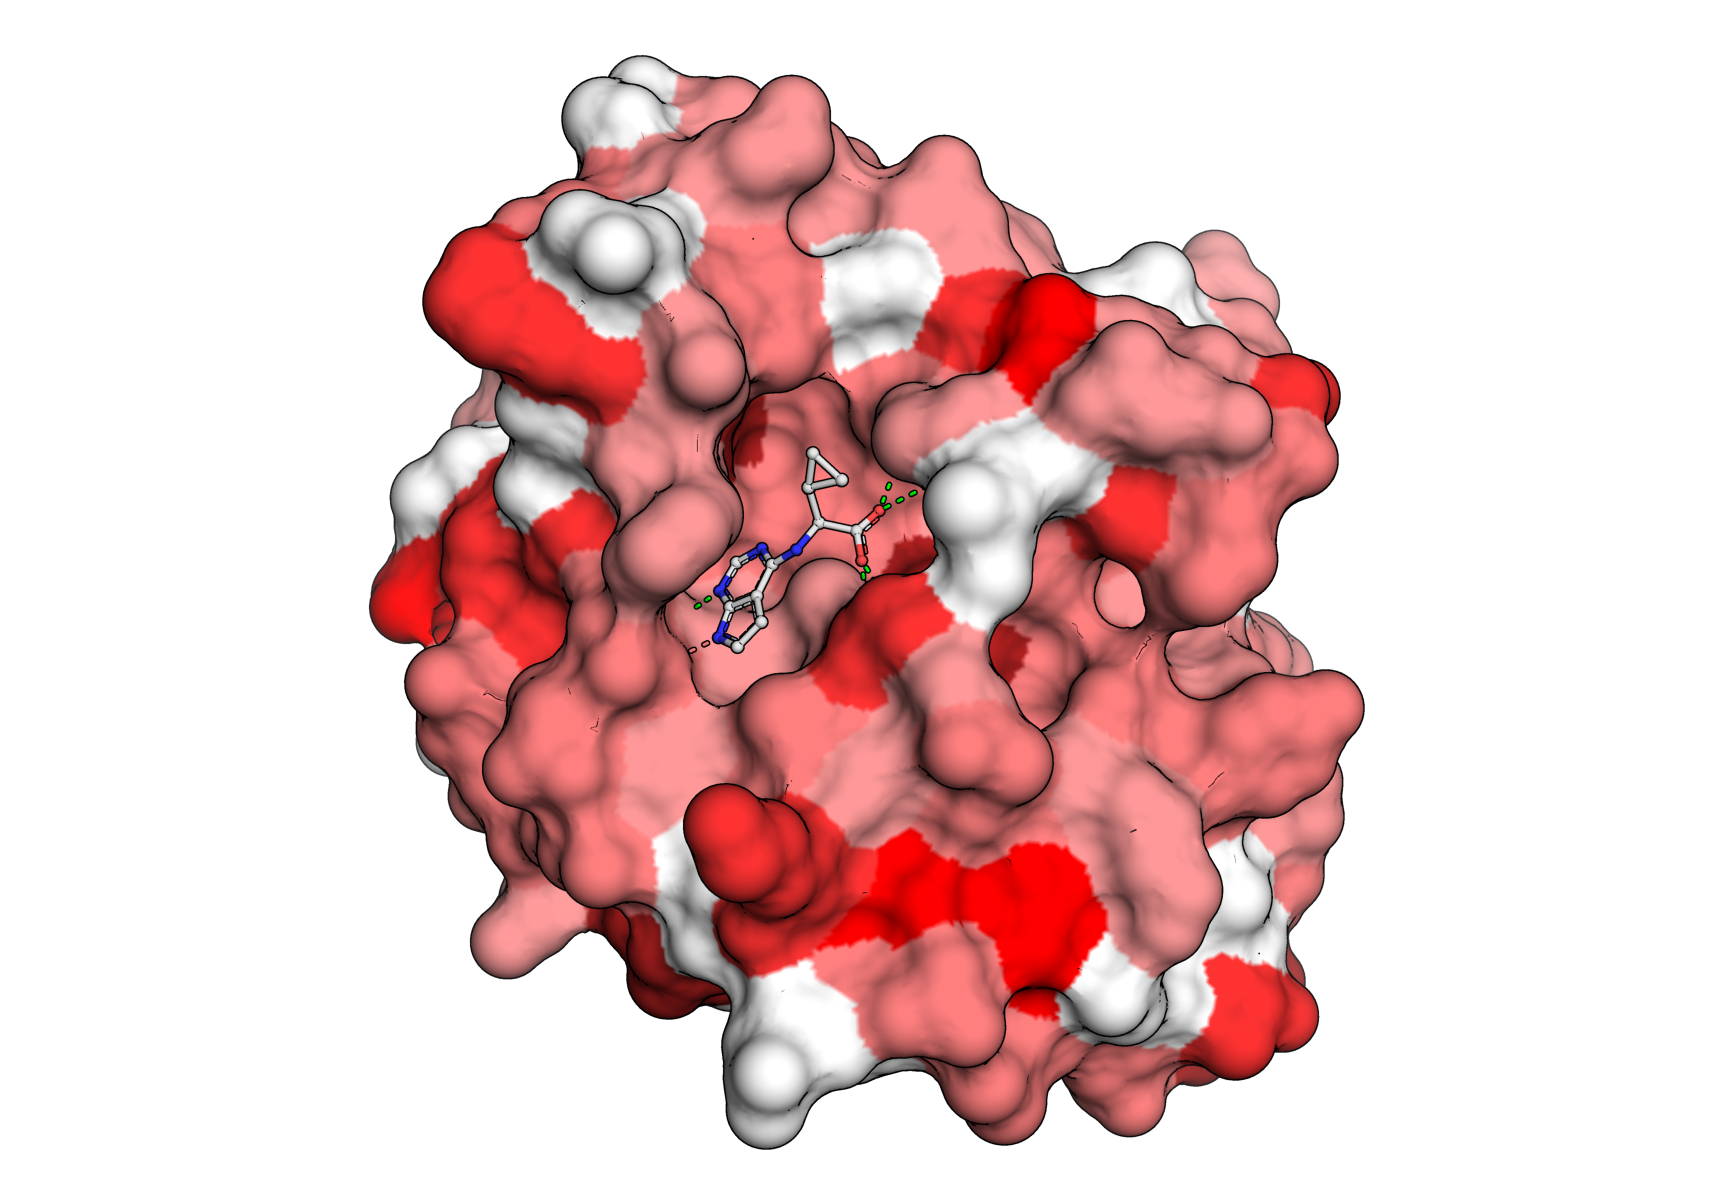
The same coloring is used for the HTML view. Although the HTML view is not as high resolution as the raytraced PyMOL session, it is very useful for communicating sites of interest because of its logoplot pop-ups (see the top-left legend in the interactive view) and the ability of hosting HTML files directly onto webpages (and even dropping them into public AWS S3 buckets). The view that we generated looks like this.
Caveats to choppa
choppa is able to deal with a variety of mismatches between fitness and structural biology data. However, there are cases when the alignment may not work correctly.
If the fitness data is for a single monomer but the protein PDB is a homodimer then the fitness data will only be mapped to one of the two monomeric chains